Infographics are graphical representations of information.
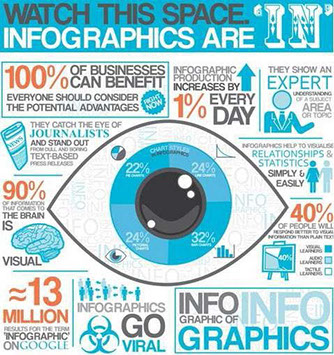
Infographics are a mix of design, writing and analysis that are ideal for an age of big data. (just like you see at the top of this page)
Infographics are a visually compelling communication medium that done well can communicate complex data in a visual format that is potentially viral.
They take deep data and present it in a visual shorthand.
“Infographics” is one efficient way of combining the best of text, images and design to represent complex data that tells a story that begs to be shared.
Click on this link to see a few examples
Or take a look below:
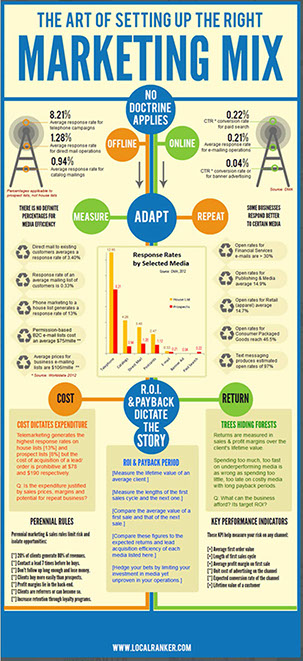
Source:
http://piktochart.com/wp-content/uploads/2012/08/LocalRanker.com_.png
Webinars

source:
http://piktochart.com/wp-content/uploads/2012/06/the-webinar-way-fame-fortune_thumb.png
Work from anywhere
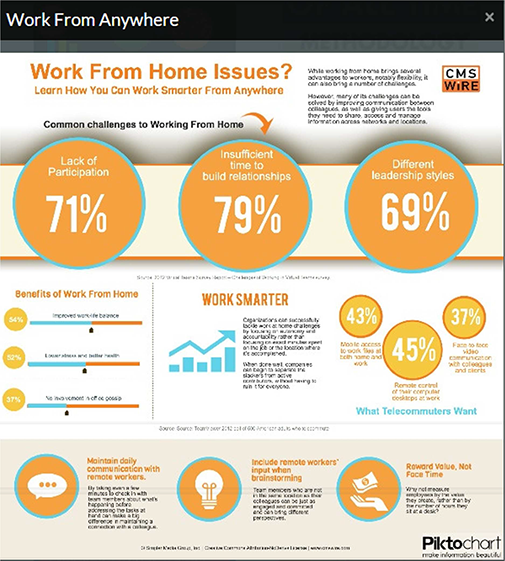
Source: http://piktochart.com/wp-content/uploads/2014/03/work-from-home.jpg